The Problem: The Friction of Repetitive kubectl Commands
Querying a Kubernetes cluster with kubectl works well for occasional checks. A quick kubectl get nodes or kubectl get pods answers basic questions quickly enough.
The difficulty starts when you are actively troubleshooting an incident across multiple namespaces. Diagnosing an issue rarely involves running a single command. Instead, you end up repeating an exhausting sequence of commands in a loop:
# The routine diagnostic loopkubectl get pods -n production -o widekubectl describe pod auth-service-78f8f9b96c-48x2m -n productionkubectl logs -f auth-service-78f8f9b96c-48x2m -n production -c apikubectl exec -it auth-service-78f8f9b96c-48x2m -n production -- /bin/shkubectl port-forward svc/auth-service 8080:80 -n productionEvery step requires copying randomized pod hashes, retyping namespace flags, and waiting for terminal outputs that quickly scroll past your buffer. If a workload runs across three different namespaces or multiple replica sets, you end up opening separate terminal windows or chaining shell aliases just to maintain context.
Shell aliases like kgp or tools like kubectx and kubens save keystrokes, but they do not solve the root problem: kubectl prints static snapshots of a system that is constantly changing. To get live visibility, you need an interactive tool that reflects cluster state in real time.
Bridging the Gap: What is K9s?
K9s is an open-source Terminal User Interface (TUI) written in Go by Fernand Galiana. It acts as an interactive command center for Kubernetes clusters, running directly inside your terminal session.
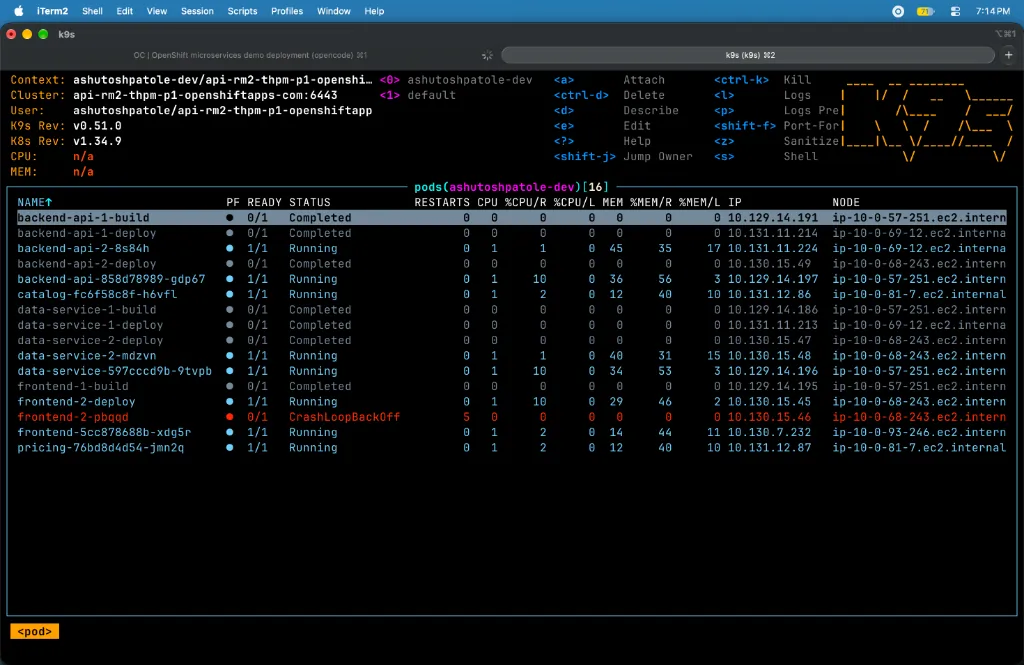
K9s connects to your cluster using your existing ~/.kube/config credentials. It does not require installing server-side agents, CRDs, or special cluster privileges: whatever permissions your current kubeconfig context has, K9s respects and enforces.
Instead of running individual CLI commands, K9s provides a continuous, live overview of your workloads:
- Workload Health: Color-coded indicators immediately highlight crashing, restarting, or pending pods.
- Instant Namespace Switching: Switch between namespaces or monitor all namespaces simultaneously with a single keypress.
- Resource Utilization: Built-in meters track CPU and memory usage across pods and nodes in real time.
- Multi-Resource Navigation: Jump between Deployments, Services, ConfigMaps, Secrets, and Custom Resource Definitions using vim-style command inputs.
Everything is keyboard-driven, fast, and light on system resources.
Installation
K9s ships as a compiled Go binary, making installation simple across all major platforms.
Requirements
- A valid Kubernetes cluster with access configured in
~/.kube/config. - Metrics Server installed on the cluster (optional, required if you want CPU and memory utilization meters).
macOS (Homebrew)
brew install derailed/k9s/k9sLinux
Using the official installation script:
curl -sS https://webinstall.dev/k9s | bashOn Arch Linux via the AUR:
yay -S k9sWindows
Using Scoop:
scoop install k9sUsing Chocolatey:
choco install k9sNavigating Daily Workflows
To launch K9s with your currently active kubeconfig context, simply run:
k9sYou can also target a specific namespace or context directly on startup:
k9s -n staging --context my-cluster-context1. Jumping Between Resources with Command Mode
Like vim, K9s uses a colon (:) to activate command mode. Typing a colon followed by a resource name or its standard abbreviation jumps directly to that resource view:
:podor:po: View pods in the current namespace.:deploy: View Deployments.:svc: View Services.:cm: View ConfigMaps.:sec: View Secrets.:ing: View Ingress resources.:nodeor:no: View cluster nodes and capacity.:ns: Switch active namespaces, or select0to view all namespaces at once.
Pressing Enter confirms the jump, while Esc always takes you one level back.
2. Live Log Streaming Across Containers
When a service misbehaves, selecting the pod and pressing l opens a live log viewer. Unlike kubectl logs, you do not have to know the container names in advance. If a pod has multiple containers, K9s prompts you to select one, or allows you to view logs across all containers combined.
Inside the log viewer:
0: Toggle between streaming live logs and viewing the complete historical log buffer.t: Toggle line timestamps on and off.w: Toggle word wrap./: Search for specific keywords, error messages, or HTTP status codes in the stream.
You can even navigate to the :deploy view, highlight a Deployment, and press l to stream aggregated logs across every replica in that Deployment at the same time.
3. Inspecting Manifests and Descriptions
To understand why a pod failed to schedule or why a health check is failing, press d on any highlighted item to run an immediate describe action. K9s formats the output with syntax highlighting, and you can jump straight to the recent events section at the bottom.
If you need to check the raw definition:
- Press
y: View the resource's clean YAML manifest. - Press
e: Open the live manifest inside your system editor ($EDITOR), allowing you to make quick config updates directly.
4. Direct Shell Access Without CLI Ceremonies
Attaching to a running pod for debugging typically requires typing kubectl exec -it <pod-name> -n <namespace> -c <container> -- /bin/sh.
In K9s, highlight the pod and press s. K9s instantly drops you into an interactive shell inside the primary container. When you type exit or terminate the shell session, you are returned right back to your K9s dashboard without losing your place.
5. Managing Port-Forwards Interactively
Testing an internal cluster service from your local machine often means running background port-forwards that are easy to forget about.
In K9s, highlight a Service or Pod and press Shift+f. A dialog prompts you for the local port and target port. Once confirmed, the forward runs in the background. You can inspect, monitor, or terminate active forwards at any time by jumping to the :portforwards (or :pf) view.
Keybindings Cheatsheet
Here are the essential shortcuts that cover most day-to-day cluster management tasks:
| Key | Action |
|---|---|
: | Enter command mode to jump to any resource (:pod, :svc, :node, :ns) |
/ | Filter or search items in the current view |
j / k or ↑ / ↓ | Navigate through list items |
Enter | Drill down into selected resource (e.g., view pod containers from deployment) |
Esc | Go back to previous view or clear active filter |
l | Stream logs for the selected pod, deployment, or container |
d | Describe the selected resource |
y | View YAML manifest |
e | Edit live resource in your default $EDITOR |
s | Open an interactive shell inside the selected container |
Shift+f | Set up a port-forward to a local port |
Ctrl+d | Delete the selected resource (requires explicit confirmation) |
Summary
kubectl remains the foundation for automated CI/CD pipelines, cluster provisioning scripts, and infrastructure as code. But for human operators, manually typing commands and managing pod hashes creates unnecessary drag during active development and incident troubleshooting.
K9s removes that friction by turning cluster administration into a smooth, keyboard-driven navigation experience. It keeps you informed of cluster health in real time, lets you jump from pods to logs to shells in seconds, and requires zero setup beyond your existing kubeconfig.
If you are diagnosing active cluster incidents where pods are running but services remain unreachable, see our practical debugging walkthroughs in Pod Is Running but Not Ready and Payments API Down While Pods Are Ready.
And if you also work with local container development before deploying to Kubernetes, explore Lazydocker: Terminal Dashboard for Docker for the Docker equivalent.